FactoryInsight
FactoryInsight opens on a mock role screen. Pick any role to enter the seeded factory dashboard; no private credentials are needed.

Overview
A manufacturing performance dashboard for tracking downtime, machine health, countermeasures, and shift-level decisions.
Case Study
Why I built it.
Role
Full-stack developer
Audience
Operations managers, maintenance teams, process-improvement leads, and manufacturing teams that need clearer production visibility.
Business Problem
Downtime data is usually scattered across spreadsheets, shift notes, operator comments, and informal follow-up lists. That makes it difficult to see repeat losses, assign countermeasures, or hand a clear story to the next shift.
Approach
How I approached it.
01
Created a fictional factory data model around machines, shifts, downtime reasons, lost output, active actions, and handover reports.
02
Built a FastAPI and PostgreSQL backend so the dashboard is driven by real data relationships rather than static mockups.
03
Created focused screens for factory health, downtime exploration, machine drilldowns, countermeasure ownership, and shift-ready reporting.
04
Kept the limits clear: this does not claim live PLC, SCADA, MES, OPC UA, or production network integration.
Build Notes
Technical shape.
Project Type
Operations dashboard demo
Primary Workflow
Downtime analysis to action tracking
Backend
FastAPI plus PostgreSQL
Deployment
Docker and Coolify on x-os
What It Shows
Why it is useful.
Shows how messy factory events can become dashboards, filters, drilldowns, and reports.
Shows practical data modelling for machines, shifts, losses, and countermeasures.
Covers the UI, API, database model, seed data, and deployment rather than just a static design.
Useful evidence for manufacturing, logistics, maintenance, and process-improvement conversations.
Screenshots
Screens that matter.
Each capture uses safe demo data and shows the parts a real user would care about: the main view, the deeper work screens, and the handoff or customer-facing state.

Dashboard Overview
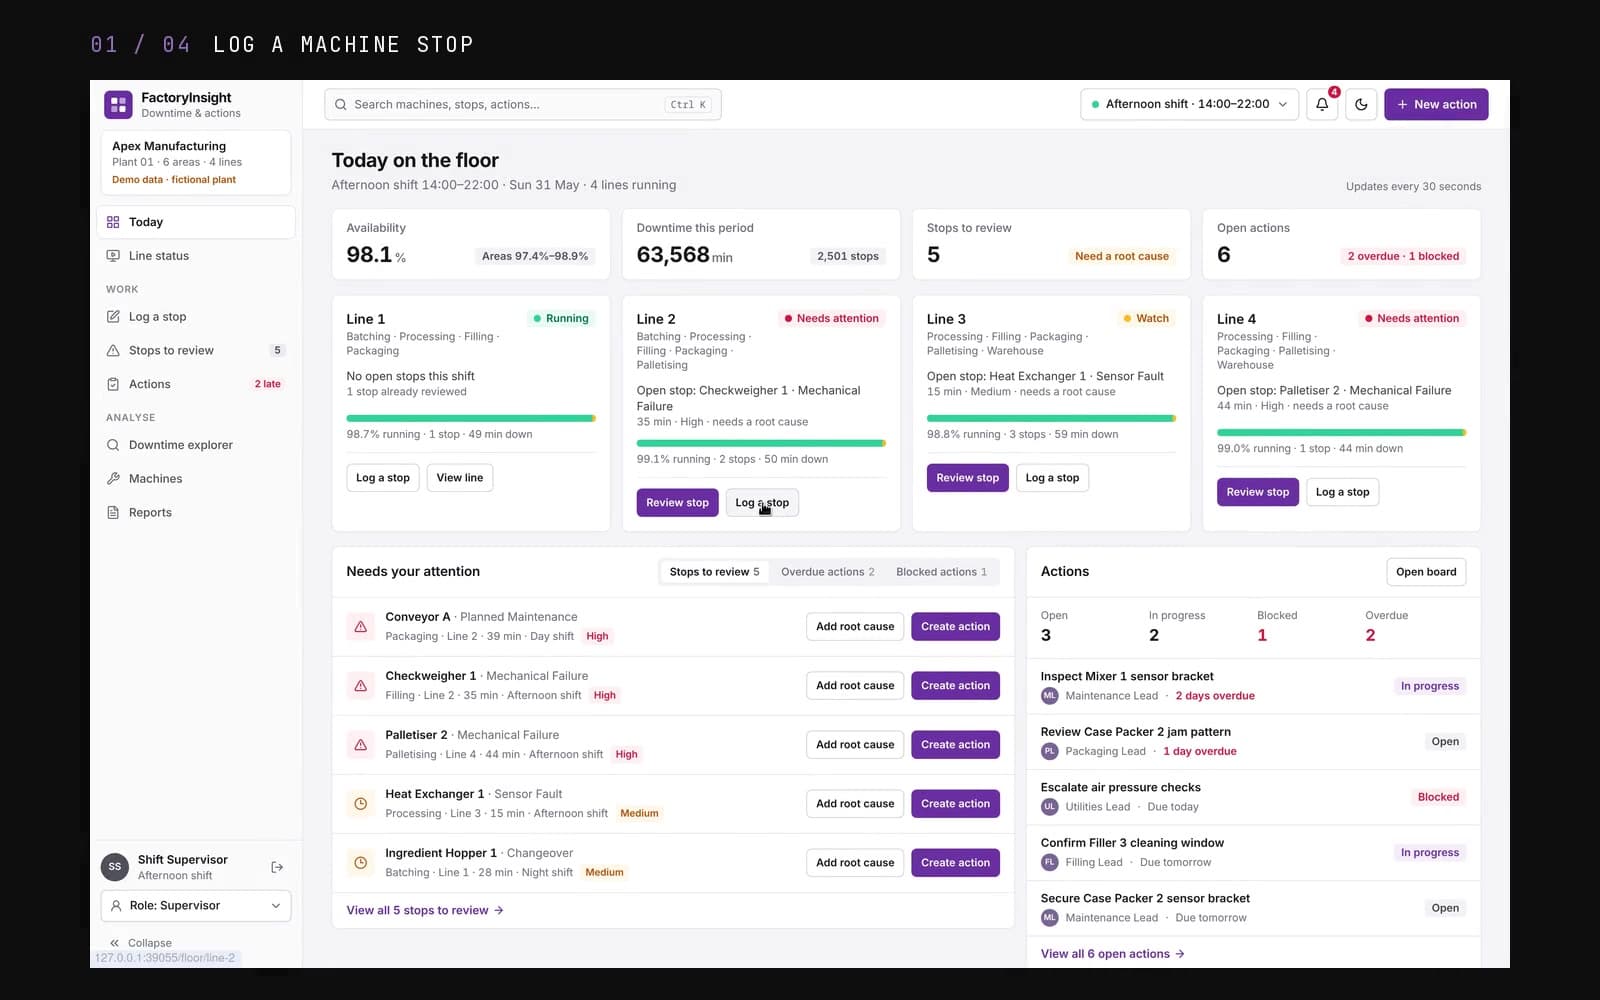
Factory health screen showing availability, downtime minutes, lost output, open actions, top losses, and the issues that need attention next.

Downtime Explorer
Filterable event analysis for comparing machines, shifts, reasons, and statuses so recurring losses are easier to find.

Shift Report
Printable handover view that turns downtime, countermeasures, and operational notes into a clear shift-level summary for the next team.
Demo Limits
FactoryInsight uses fictional manufacturing data only. A real installation would need a separate ingestion, validation, security, and integration plan before connecting to production systems.
The Challenge
Factory teams often lose time because downtime causes, follow-up actions, and shift handovers live across spreadsheets, whiteboards, and messages. Supervisors need one place to see what is failing, what changed, and what needs attention next.
The Solution
I built a working dashboard that turns seeded factory data into views a supervisor or engineer could use: factory health, downtime trends, action tracking, machine drilldowns, and shift reports.
Live
Demo Status
Seeded
Data Mode
6+
Core Views
Ops
Focus
Key Features
What it does.
01
Factory Health Overview
High-level KPIs for uptime, downtime minutes, open actions, and active production issues.
02
Downtime Intelligence
Charts and breakdowns that show recurring downtime patterns by machine, reason, and shift.
03
Countermeasure Tracking
Action board for assigning follow-ups, tracking status, and keeping issue ownership visible.
04
Machine Drilldowns
Focused pages for reviewing machine-level performance, events, and recent context.
05
Shift Reports
Structured handover and reporting views so the next team can see what happened and what still matters.
06
Safe Demo Data
The public demo uses seeded factory data, so it can be inspected without exposing private information.
Tech Stack
Built with.
Frontend
Backend
Data
Infra